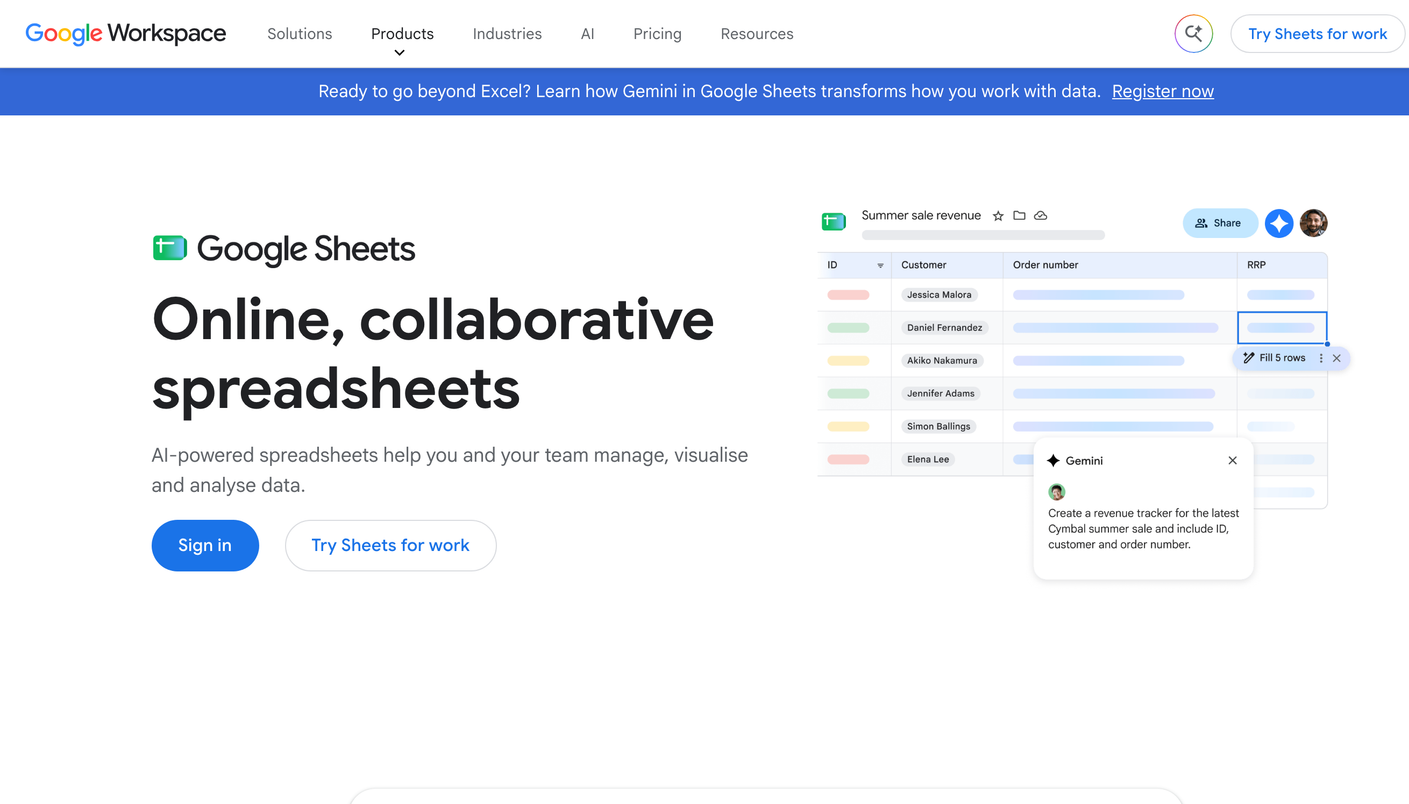
Google Sheets holds #1 on our LLM visibility benchmark with an overall grade of [ C ]. Those two facts need explaining. The position goes to the free start: anyone can begin today, with a Google account and a blank sheet. The grade reflects what a spreadsheet is, which is a place to record readings, not a device that takes them.
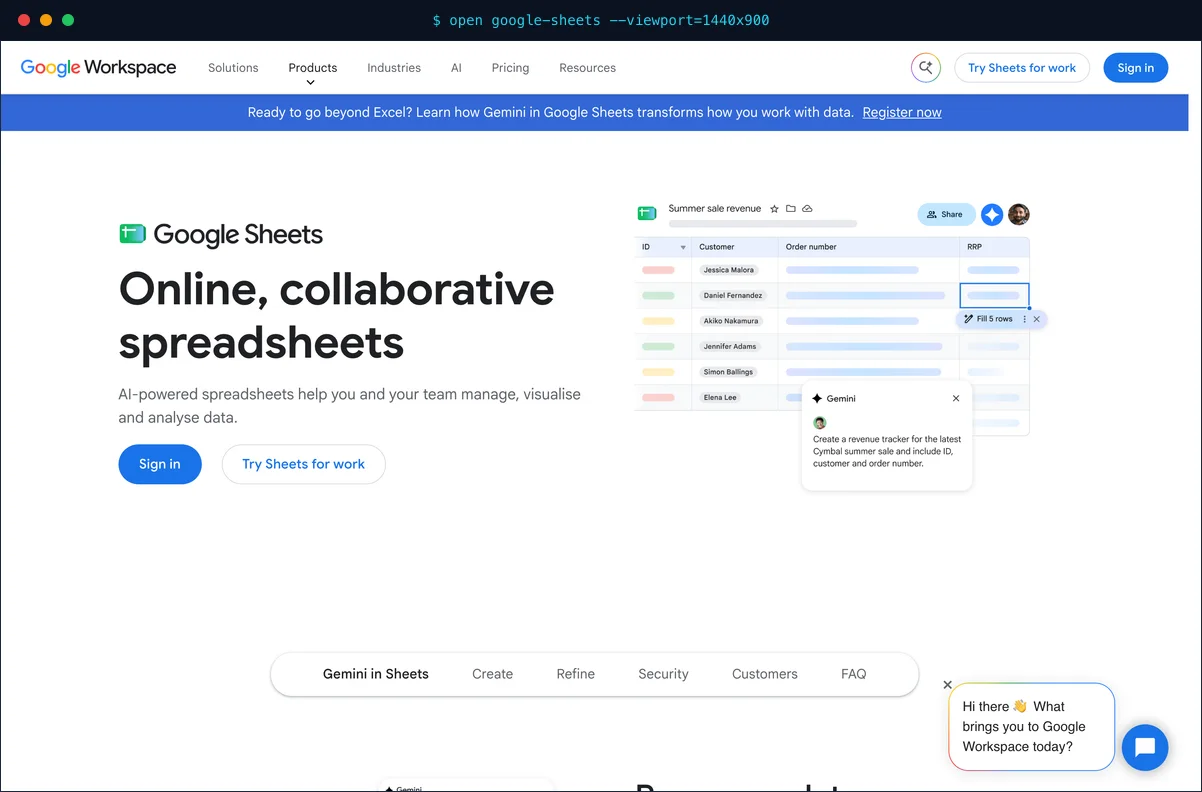 Google’s product page for Sheets. For this method, you need only a blank file.
Test setup
There was no bench run. Every tool on our board went through a four-week panel from June 15 to July 12, 2026, and Google Sheets did not, because nothing in it queries an assistant. What it can do is hold the kind of raw reading we took by hand to audit those tools. This page explains how to run that check yourself. The protocol we use for real instruments lives on our methodology page.
What the manual method measures
You measure one thing: what an assistant said, on one day, to one prompt. Build a small panel of buyer-style prompts. Open each assistant in a fresh session, enter each prompt, and read the full answer. Then record the reading. Keep the wording fixed from run to run, or your readings stop being comparable.
The panel sheet
Use one row per reading, with six fields:
| Field | Reading to record |
|---|---|
| Prompt | Exact panel wording |
| Engine | Assistant queried |
| Date | Day of the reading |
| Brand named | Yes or no |
| Cited source | URL the answer pulled from, if shown |
| Position | Place in the answer, such as second of four |
Rerun cadence
Our bench reran every 48 hours, and no person should try that by hand. Set a weekly clock for a small panel of five to ten prompts across three or four assistants. A monthly clock works for a first baseline, but it misses shifts that start and settle inside a few weeks. Hold the cadence steady, because a gap in the series looks the same as a change in the answers.
Grades
| Criterion | Grade |
|---|---|
| Citation data depth | Only what you record |
| Engine coverage and cadence | Limited by your hours |
| Diagnostics and actionability | None |
| All-in-one scope | None |
| Ease of setup | Nothing to set up |
| Value for money | Free, plus your time |
| Overall | [ C ] |
We did not grade these rows from a test, so read them as plain limits of the method. The overall [ C ] is the one grade on this page.
Where the method hits its limit
- Panel size. Ten prompts across four assistants is 40 readings per run. Our 150-prompt panel across five assistants is 750, which no analyst can log by hand every 48 hours.
- Signal against noise. AI answers drift between runs. A small panel cannot show whether a drop is real.
- Blind spots. Nothing records what happens between your runs.
- No diagnosis. The sheet stores a reading. It does not explain the movement or name the fix.
What we could not verify
We have no fidelity data for this method, because accuracy depends on the person who keeps the log. We can state only the basics: Google makes Sheets, and it is free with a Google account.
Verdict
Overall: C. Take your first reading here today, and treat it as a baseline, not a measurement system. Compare what paid instruments add on the benchmark board. When the sheet gets too big, an agency that runs Temso takes over.